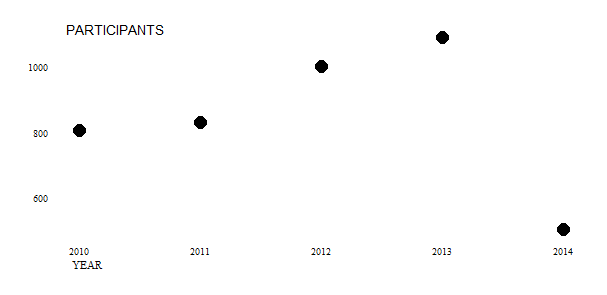
The graphical visualization skills of the New York Times leave me envious. For that reason, a plot in the sports section on August 12, 2015 regarding aces by male tennis players caught my eye. Not having the data available to the Times, I sort-of re-created the plot below. In the same style, mine shows how many law departments participated in the GC Metrics benchmarking survey, sponsored by Major, Lindsey & Africa, during its first five years.

The three salient features of the plot that are discussed below are (1) the location of the axis labels, (2) the case used for them, and (3) the absence of a title.
The axis label for the vertical, y-axis perches on top of that axis and reads left-to-right instead of in the usual location in the middle and rotated 90 degrees. It is easier to read left to right, to be sure, but it takes a moment to locate a label far from the customary place. The axis label for the horizontal axis lurks on the far left, instead of in the middle of the plot. Perhaps this placement has advantages, perhaps not.
 Law Department Management Blog

